
Fayl:Projected Change in Temperatures.svg

Size of this PNG preview of this SVG file: 600 × 600 piksel. Boshqa oʻlchamlari: 2 048 × 2 048 piksel.
Asl fayl (SVG fayl, asl oʻlchamlari 960 × 960 piksel, fayl hajmi: 1,07 MB)

Qisqa izoh
| Taʼrif |
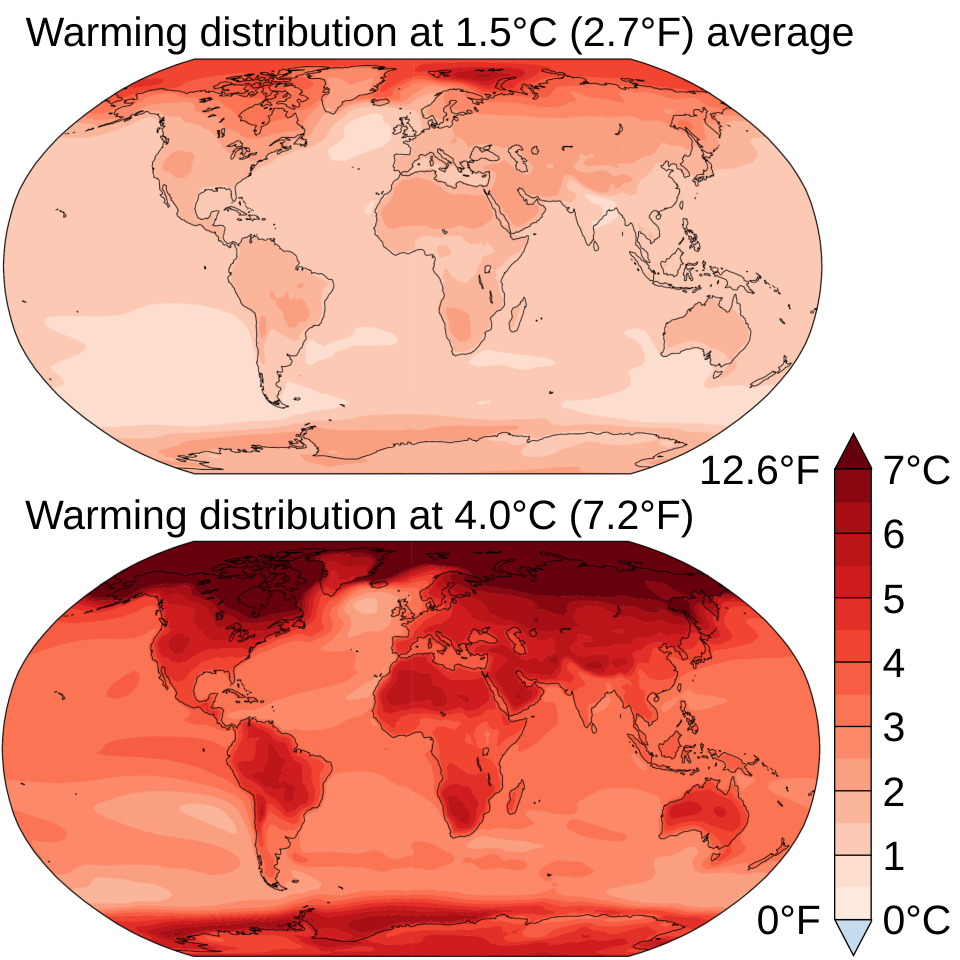
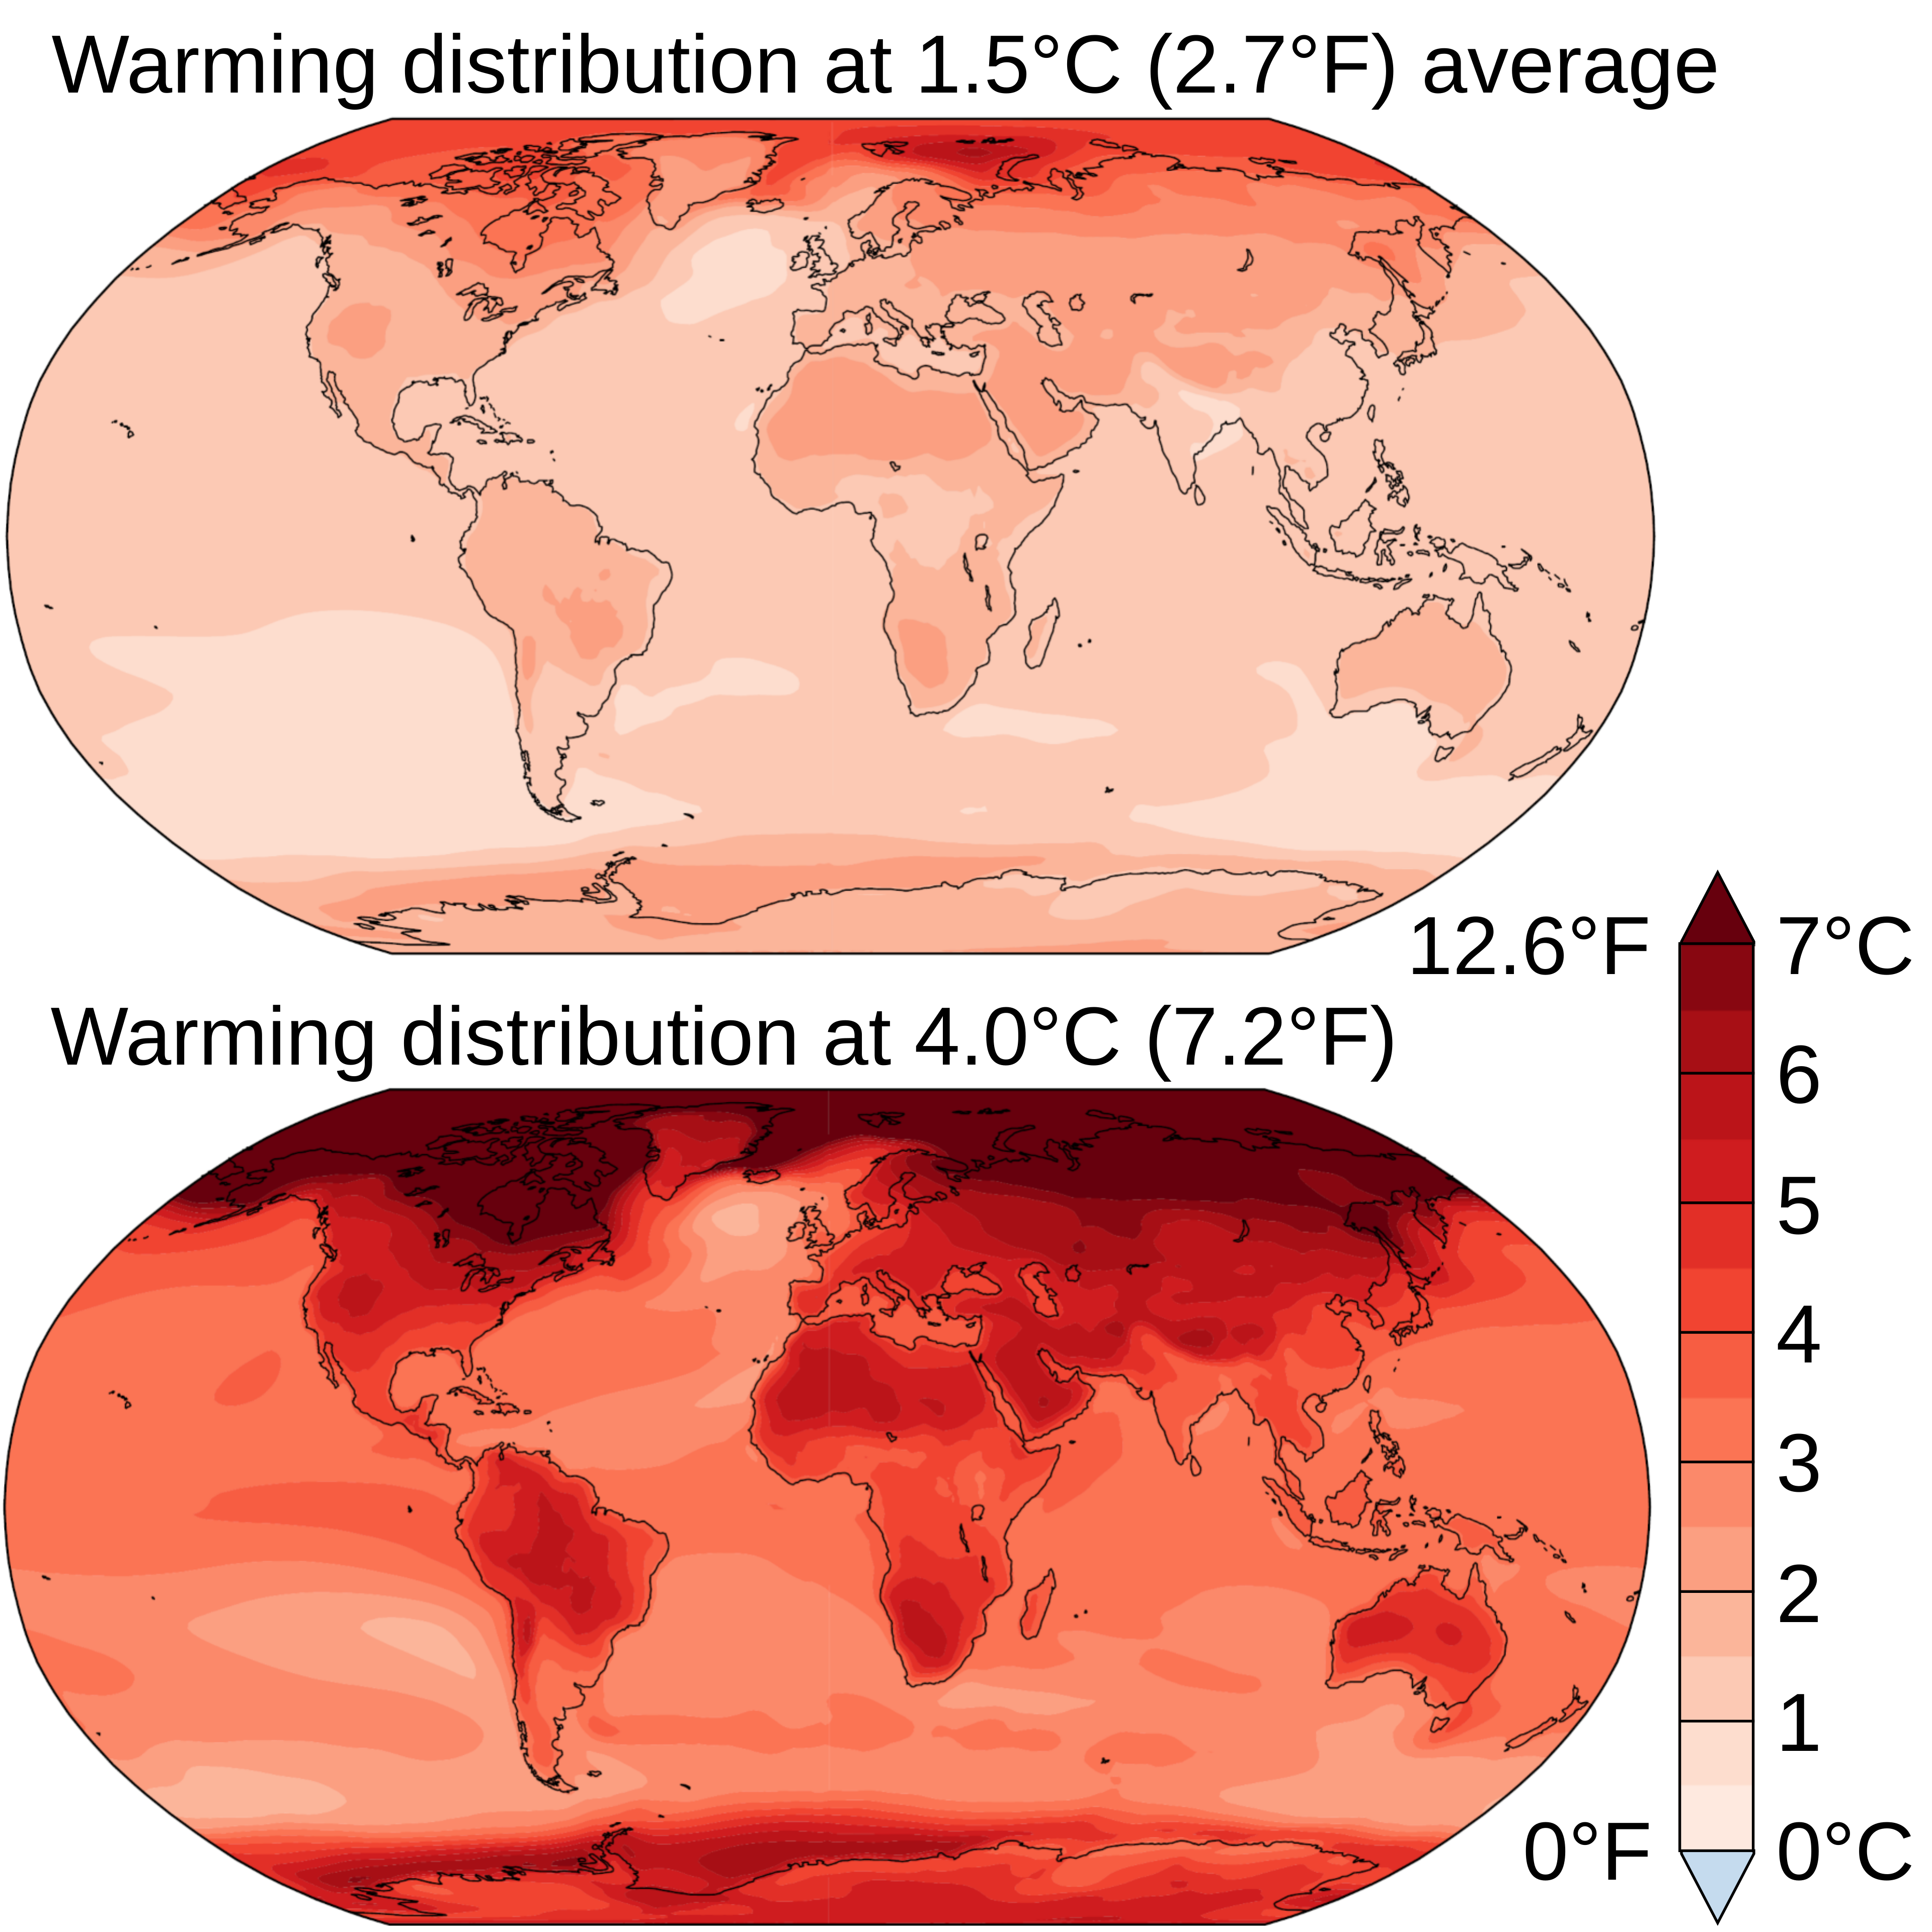
English: Coupled Model Intercomparison Project Phase 6 (CMIP6) multi-model mean projections (i.e., the average of the model projections available). Changes are shown relative to the 1850-1900. Data from the IPCC Sixth Assessment Report SPM.5. Note that maps were only produced for temperatures at 1C, 1.5C, 2C, and 4C. This graphic uses 1.5C and 4C as they average to the 2.7C that is the most likely outcome.
Français : Projections moyennes multimodèles de la phase 6 du projet d'intercomparaison de modèles couplés (CMIP6) (= moyenne des projections de modèles disponibles). Les changements sont indiqués par rapport à l'ère préindustrielle (1850-1900). Données du sixième rapport d'évaluation du GIEC SPM.5 |
| Sanasi | |
| Manba | Oʻzimning ishim |
| Muallif | Efbrazil |
| Other versions | French version |

Litsenziyalash
I, the copyright holder of this work, hereby publish it under the following license:


This file is licensed under the Creative Commons Attribution-Share Alike 4.0 International license.
- Siz erkinsiz:
- ulashishga – ishlanmani nusxalash, tarqatish va uzatish
- remiks qilishga – ishni moslashtirishga
- Quyidagi shartlar asosida:
- atribut – Siz tegishli litsenziyaga havolani taqdim etishingiz va oʻzgartirishlar kiritilganligini koʻrsatishingiz kerak. Siz buni har qanday oqilona yoʻl bilan qilishingiz mumkin, lekin litsenziar Sizni yoki Sizning foydalanishingizni ma'qullashini taklif qiladigan tarzda emas.
- bir xil ulashish – Agar Siz materialni remiks qilsangiz, oʻzgartirsangiz yoki unga asoslansangiz, oʻz hissalaringizni asl nusxadagi kabi bir xil yoki mos litsenziya ostida tarqatishingiz kerak.
These maps contain data from the IPCC that is not believed to be subject to their copyright. According to the wikimedia article discussing derivative works using maps none of the following are subject to copyright: data, colors, systems, and geographical boundaries. That covers all that these maps display- they are standard world maps colored to show expected temperature changes according to climate change models.
Fayl tarixi
Faylning biror paytdagi holatini koʻrish uchun tegishli sana/vaqtga bosingiz.
| Sana/Vaqt | Miniatura | Oʻlchamlari | Foydalanuvchi | Izoh | |
|---|---|---|---|---|---|
| joriy | 16:45, 2026-yil 11-sentyabr | | 960 × 960 (1,07 MB) | wikimediacommons>Darafsh | File uploaded using svgtranslate tool (https://svgtranslate.toolforge.org/). Added translation for fa. |
Fayllarga ishoratlar
Bu faylga bogʻlangan sahifalar yoʻq.
