
Fayl:Carbon Dioxide 800kyr.svg

Qisqa izoh

|
This SVG file contains embedded text that can be translated into your language, using any capable SVG editor, text editor or the SVG Translate tool. For more information see: About translating SVG files. |
| Taʼrif |
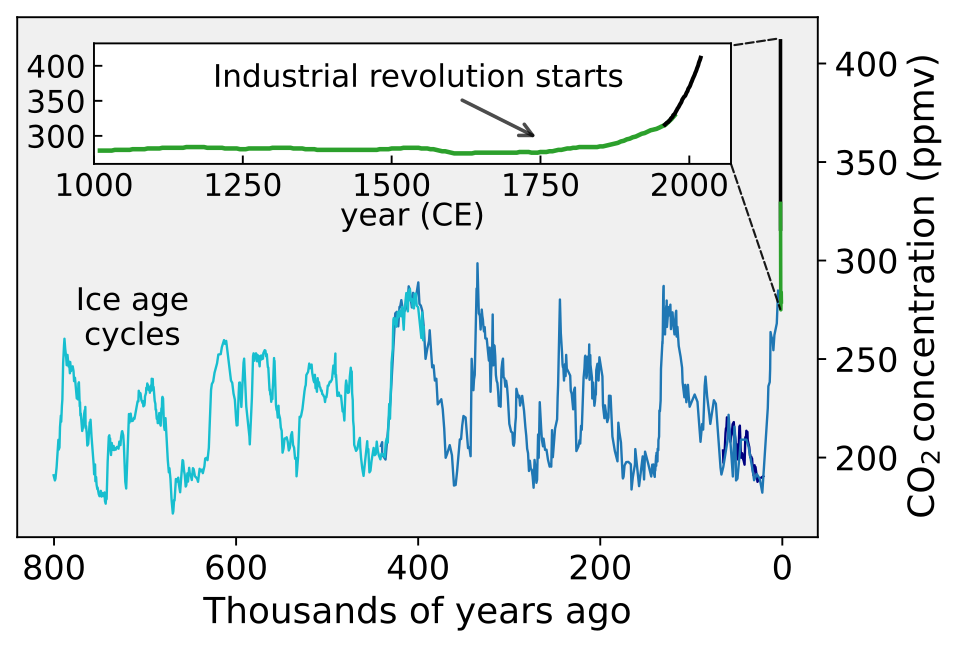
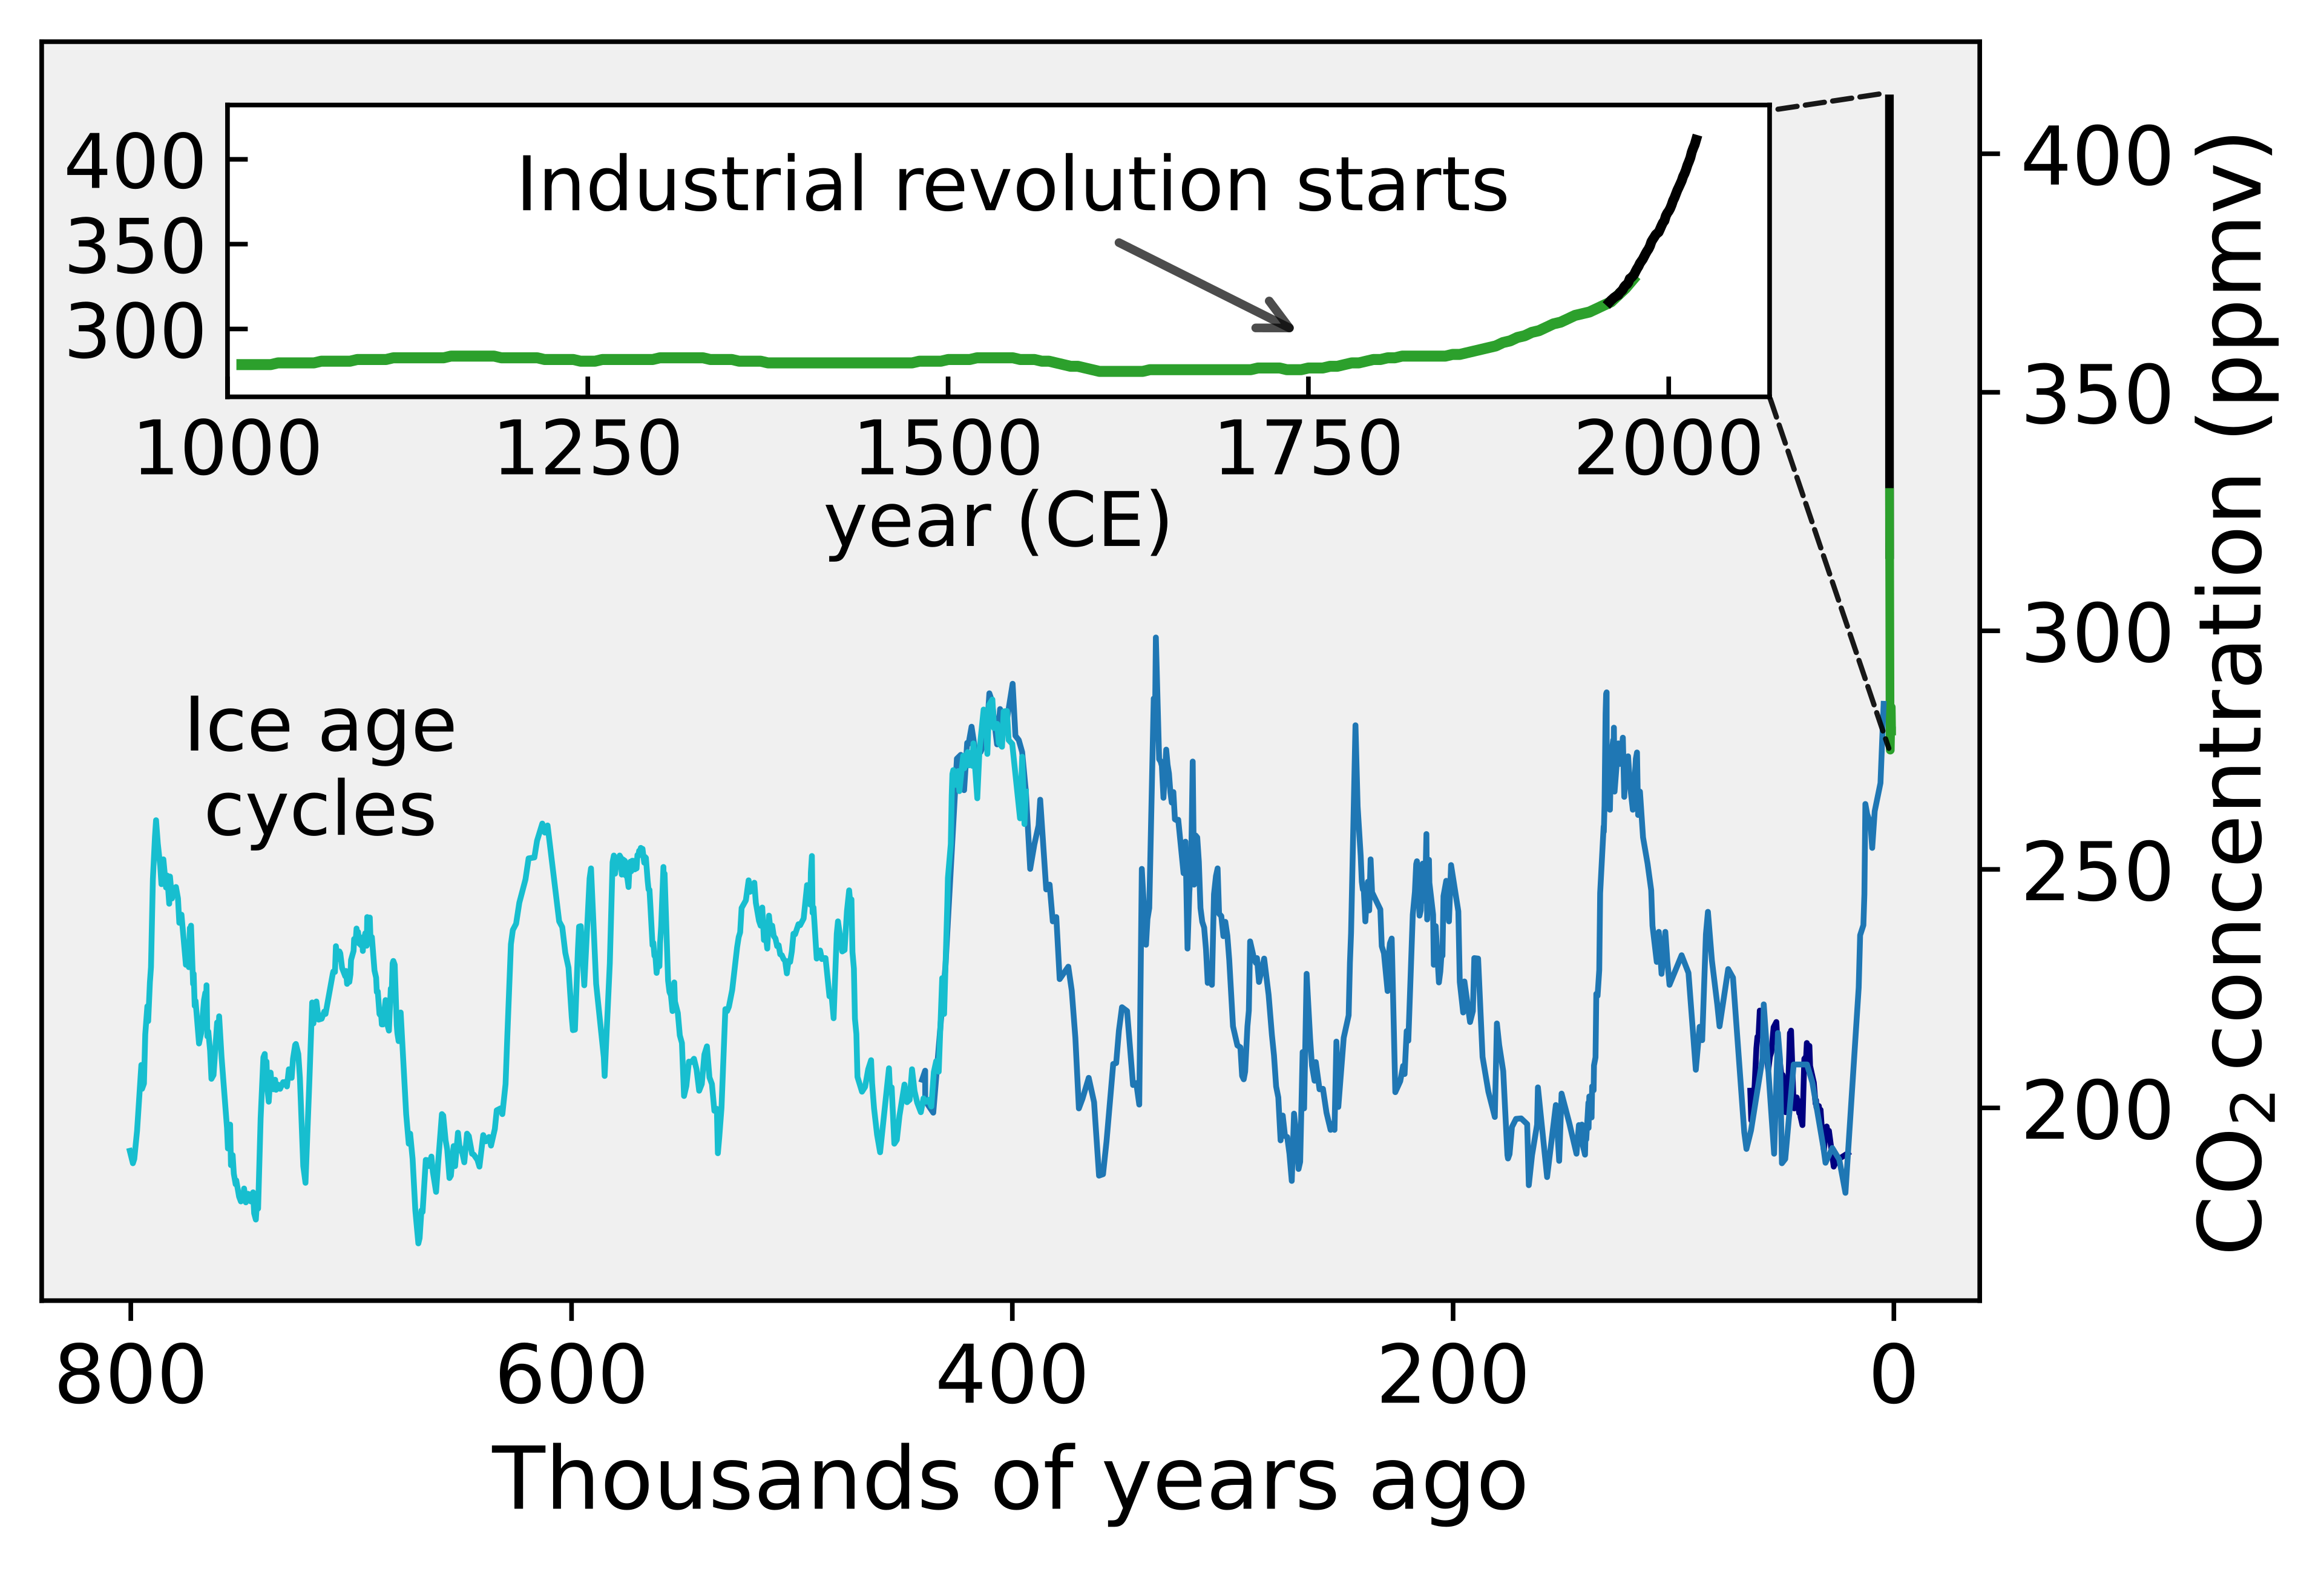
English: This figure shows the variations in concentration of carbon dioxide (CO2) in the atmosphere during the last 800 thousand years. Throughout most of the record, the largest changes can be related to glacial/interglacial cycles within the current ice age. Although the glacial cycles are thought to be directly caused by changes in the Earth's orbit (i.e. Milankovitch cycles), these changes also influence the carbon cycle, which in turn feeds back into the glacial system.
Since the Industrial Revolution, circa 1800, the burning of fossil fuels has caused a rapid increase of CO2 in the atmosphere, reaching levels unprecedented in the last million years. This increase has been implicated as a primary cause of global warming. The spacing of carbon dioxide samples varies through time. At the present, the atmosphere is sampled routinely and complete annual averages are available. From the four ice cores presented on this plot the sampling varies from as rapid as one point every few years (recent parts of the Law Dome record) to as sparse as one sample every few thousand years (oldest parts of the Vostok and Dome C records). In principle, the sparse sampling in the oldest parts of the record could hide abrupt excursions; however, isotopic measurements of ice cores (which are made continuously along the entire core) and our current understanding of the rates of natural processes for creating and removing carbon dioxide from the atmosphere make it unlikely that any positive excursions in carbon dioxide comparable to the Industrial Revolution have happened during the interval presented above. This figure is an update on File:Carbon Dioxide 400kyr.png, originally made by User: Dragons flight originally made by Dragons flight. The explanation of the figure is also derived from that work. Two new data sets are added: the CO2 measurements from 2004 to 2019 and additional data from Dome C. Some other data sets were omitted for simplicity. The code to produce this figure is freely available on Github: https://github.com/Femkemilene/Global-Warming-Figures. The first few lines of the code make it easy to change the language. |
| Sanasi | |
| Manba | Oʻzimning ishim |
| Muallif | Femke Nijsse |
| Other versions |
File:Carbon Dioxide 800kyr.svg has 4 embedded translations.
|




Data sources
- (light blue) Dome C ice core: Lüthi, D., M. Le Floch, B. Bereiter, T. Blunier, J.-M. Barnola, U. Siegenthaler, D. Raynaud, J. Jouzel, H. Fischer, K. Kawamura, and T.F. Stocker (2008). "High-resolution carbon dioxide concentration record 650,000-800,000 years before present". Nature 453: 379-382. DOI:10.1038/nature06949.
- (dark blue) Vostok ice core: Fischer, H., M. Wahlen, J. Smith, D. Mastroianni, and B. Deck (1999). "Ice core records of Atmospheric CO2 around the last three glacial terminations". Science 283: 1712-1714.
- (navy blue) Taylor Dome ice core: Indermühle, A., E. Monnin, B. Stauffer, T.F. Stocker, M. Wahlen (1999). "Atmospheric CO2 concentration from 60 to 20 kyr BP from the Taylor Dome ice core, Antarctica". Geophysical Research Letters 27: 735-738.
- (green) Law Dome ice core: D.M. Etheridge, L.P. Steele, R.L. Langenfelds, R.J. Francey, J.-M. Barnola and V.I. Morgan (1998) "Historical CO2 records from the Law Dome DE08, DE08-2, and DSS ice cores" in Trends: A Compendium of Data on Global Change. Carbon Dioxide Information Analysis Center, Oak Ridge National Laboratory, U.S. Department of Energy, Oak Ridge, Tenn., U.S.A.
- (black) Mauna Loa Observatory, Hawaii: Keeling, C.D. and T.P. Whorf (2004) "Atmospheric CO2 records from sites in the SIO air sampling network" in Trends: A Compendium of Data on Global Change. Carbon Dioxide Information Analysis Center, Oak Ridge National Laboratory, U.S. Department of Energy, Oak Ridge, Tenn., U.S.A.
Litsenziyalash


- Siz erkinsiz:
- ulashishga – ishlanmani nusxalash, tarqatish va uzatish
- remiks qilishga – ishni moslashtirishga
- Quyidagi shartlar asosida:
- atribut – Siz tegishli litsenziyaga havolani taqdim etishingiz va oʻzgartirishlar kiritilganligini koʻrsatishingiz kerak. Siz buni har qanday oqilona yoʻl bilan qilishingiz mumkin, lekin litsenziar Sizni yoki Sizning foydalanishingizni ma'qullashini taklif qiladigan tarzda emas.
- bir xil ulashish – Agar Siz materialni remiks qilsangiz, oʻzgartirsangiz yoki unga asoslansangiz, oʻz hissalaringizni asl nusxadagi kabi bir xil yoki mos litsenziya ostida tarqatishingiz kerak.
Fayl tarixi
Faylning biror paytdagi holatini koʻrish uchun tegishli sana/vaqtga bosingiz.
| Sana/Vaqt | Miniatura | Oʻlchamlari | Foydalanuvchi | Izoh | |
|---|---|---|---|---|---|
| joriy | 16:50, 2026-yil 11-sentyabr | Miniatyurasi yoʻq | 535 × 361 (69 KB) | wikimediacommons>Darafsh | File uploaded using svgtranslate tool (https://svgtranslate.toolforge.org/). Added translation for fa. |
Fayllarga ishoratlar
Bu faylga quyidagi sahifa bogʻlangan:
